The Top Tips for Monitoring Your Venue’s Website Traffic


Your venue’s website should be the most important component of your marketing strategy. In order to create a website that is successful, you first need to understand what to look for in your website analytics and which features will help you to measure and monitor your success.
With that being said, we’ll talk about a few KPIs that you should always keep an eye on. What is a KPI? It stands for Key Performance Indicator and it’s a measurable value that demonstrates how effectively a company is achieving key business objectives. Organizations use KPIs to evaluate their success at reaching targets. Using Google Analytics can help you measure actions taken on your website to determine if your site is helping your venue meet your KPIs.
Set up Google Analytics for your website
First thing’s first, make sure you have your Google Analytics business account set up with this checklist:
- Follow these steps to install Google Analytics
- Make sure Google Analytics is recording accurate data
- Enable advertising features
- Define all relevant goals and events
Once that’s taken care of and you’ve ensured that Google Analytics is linked to your website and recording data accurately, it’s time to understand a few analytics that will help your venue maximize your website visitor experience which will in return drive more business through your doors. Once you have a better understanding of why these KPIs are important, you’ll be able to adjust and improve your website to ensure you’re giving your visitors the best experience with the information they’re looking for.
Bounce rate
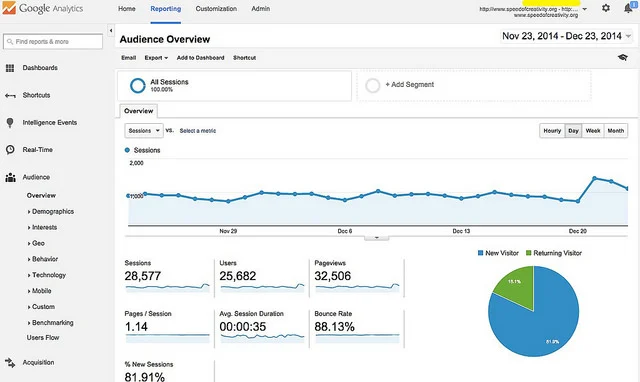
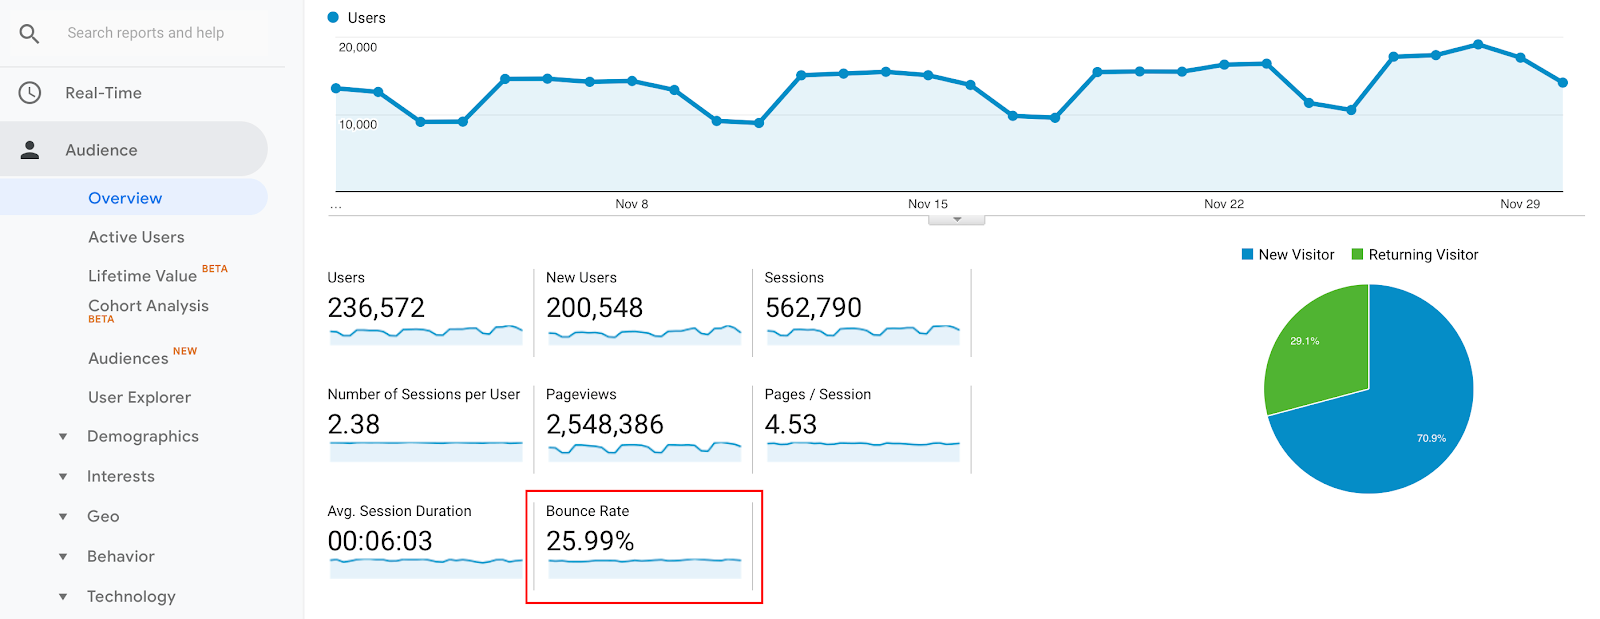 You can find your bounce rate under the audience overview section in Google Analytics, or you can look for the bounce rate of individual channels and pages under the behavior column when you’re looking at landing pages.
Once you’ve located where the bounce rate is within your analytics report, the next step is to understand what this is and what a good bounce rate would be. Google considers a bounce to be a single-page session on your site by a visitor. The bounce rate refers to the percentage of visitors that leave your website (or “bounce” back to the search results or referring website) after viewing only one page on your site.
Most websites will see bounce rates fall somewhere between 26% and 70%, according to a RocketFuel study. They also mention that a bounce rate below 20% or over 90% is usually a bad sign. The former hints at a problem with the analytics setup; the latter typically means there’s a website problem. So, it’s a good idea to have a goal of your own and to monitor this percentage based on your site and your goals, instead of any industry standards.
There are a few factors to consider while keeping an eye on this percentage:
- Website design and calls to action: This may be one of the most challenging factors when it comes to marketing. Many marketing teams like a colorful or flashy website with video, rotating pictures, music, or other attention-grabbing media. But all of this is a distraction to your visitor and makes it hard to find what they’re looking for. If you’re hit with flashy pictures, video, and music, most people will get jumpy and close the page immediately. So it’s crucial to find a way to keep your website attractive, but simple and clear at the same time. Ensuring that your CTAs (calls to action) are easily available at all times (in your headers and footers, and even embedded into content), but not too available. You want your visitor to have access but not be too pushy as some may find that obnoxious and go elsewhere. Keep a few things in mind when creating a website. Is it easy to navigate on both desktop and mobile? if your visitor can’t find what they’re looking for, is there easy search navigation? Google just released a new Core Web Vitals feature that will help quantify key aspects of the user experience, which will go a long way when it comes to website design.
- Page speed: If you have a slow-loading website that takes longer than a few seconds to load, you’re likely to lose visitors quickly as not many people have the patience. You’ll find that large images or videos can cause your pages to load slowly. There are many tools you can use (Google PageSpeed Insights, Lighthouse, Pingdom, and many others) which will give you recommendations and insight into how to compress your images, and other tips to help your pages load faster.
- Misleading tagline/meta description: When you’re creating content to drive traffic, creating compelling taglines and meta descriptions may be the hardest part. You need to create something that will catch your visitors’ attention and encourage them to click on your site. A lot of businesses have taken this opportunity to trick people into clicking on a page to sell or offer them something else. That’s not a good idea when it comes to creating loyalty and will ultimately result in a higher bounce rate since these visitors will leave quickly.
- Bad links: If you’re finding that your organic search bounce is fine, but your referral bounce is high, you should check these pages to ensure that there are no broken links. In addition, if you’re linking to and from other pages within your website or to others, it’s important to always keep an eye on these links, especially when you’re doing website updates. You can use Google Analytics to find broken links within your website, or there are many companies out there that can do this service for you and help to update and replace these links. Either way, it’s important to ensure that all links are valid and accurate, and anything that’s misleading or broken gets fixed.
These are just a few things to keep in mind when you’re looking at your bounce rate for your website. This small list below includes a few more items, in addition to the ones above, that are always good to keep in mind when you’re developing your venue’s website and looking for ways to improve the user experience.
Ways to improve your bounce rate on your website:
- Create a well-optimized website with quality content and good page speed
- Include call to action sections to engage visitors, and make them visible to visitors
- Optimize paid campaigns with clear landing pages
- Avoid using annoying pop-ups (think mobile-friendly pop-ups that don’t get in your visitors’ way)
- Do keyword research and create specific landing pages
- Pay attention to design and user experience
Audience
 Another section to monitor that will give you a deep understanding of your website visitors is the audience analytics. This section records information like your visitors’ demographics, interests, and geographic location. It can also track what software and hardware are they using to view your website and how your website analytics compare to other websites in your industry. All of this information can be found in the Audience section of Google Analytics.
The audience overview gives you a high-level look at your audience by session and users. A single session can contain multiple page views, events, social interactions, and e-commerce transactions. And a single user can open multiple sessions. So it’s good to monitor how many sessions your website had, as well as how many users accessed your site. In addition to the users, it’s good to track new vs. returning visitors so you can gauge if your content and offers are good enough for visitors to come back.
Knowing how your visitors are coming to your website is another metric to pay attention to. Are a majority of your visitors using a mobile device? If so, do you maintain your website and check it regularly to ensure it’s mobile friendly? There’s nothing worse than a website that isn’t mobile-friendly; this is another reason for higher bounce rates and abandonment.
Once you learn the basics of audience analytics, you can organize your information into segments. For example, you can group visitors to your website from the United States, who viewed your website from their mobile device, and visited your website for more than 1 minute but didn’t convert to a lead. If you’re looking for help with this, Neil Patel does a good job of explaining setting up segments in Google Analytics. Setting up your audience into segments will give you the ability to dive deeper into demographics, interests, geography, and much more.
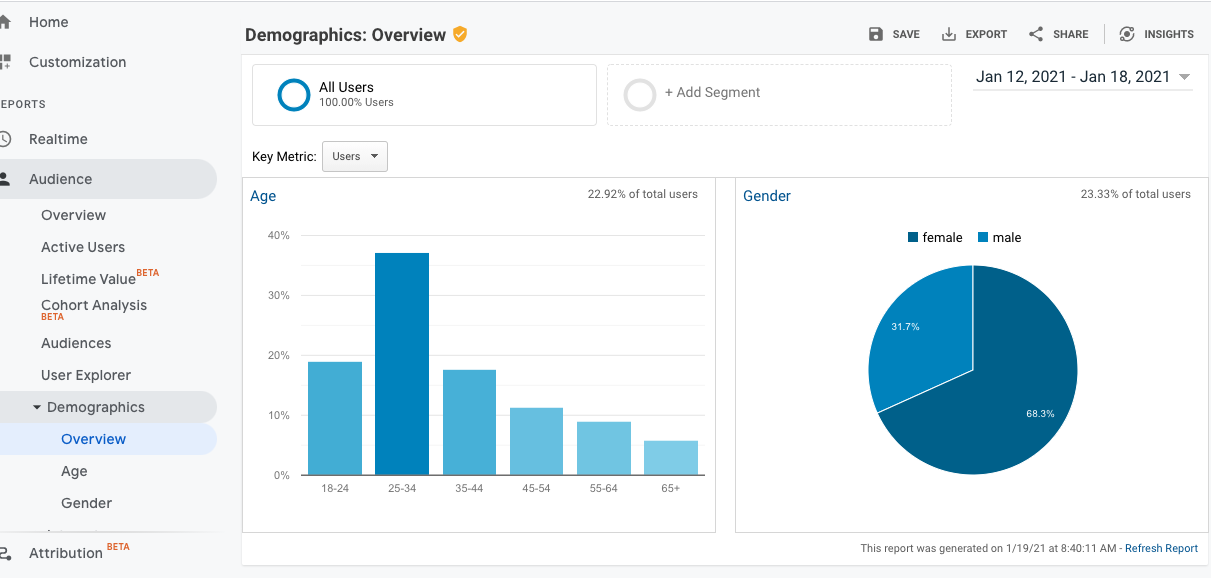 As a marketing team, once you know who your audience is, you can create content and advertising based on this demographic. When looking at the analytics example on the right, this website sees mostly males between the ages of 25-34 who are interested in arts and entertainment. Depending on what your main objective is, you can tailor your message to this profile. For example, if you’re a restaurant looking to advertise a special weekend dinner menu and entertainment, you can create messaging geared towards males of this age group that appeals to their interests.
If you’re looking for further information, you can set up custom dashboards within the audience section to dive a bit deeper into each of these sections: age, interests, location, gender, and a few others.
Once you understand who your audience is, you can create lookalike audiences to target your advertising to new users based on your current user profile. In addition, you can also retarget your current marketing strategies to the audience of people who visit but do not convert. The sky’s the limit with the amount of targeted marketing and advertising you can create based on having a deep understanding of who your audience is.
Acquisition
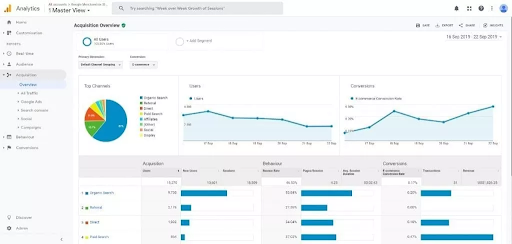 Now that we know who our audience is from the audience reporting, the next step is understanding where they’re coming from. The acquisition overview does a great job of identifying some high-level information:
- What channels are driving the most traffic to your website
- The engagement metrics for each channel
- The number of conversions and the conversion rate for each channel
After you absorb this information, you can reflect on your current marketing strategy and adjust your advertising and marketing content based on this insight. For example, based on this overview on the right, you can see that you’re converting the most through your paid advertising, which is great. But you’re receiving the most traffic through organic search, so what can you do to enhance your website content to generate more conversions from your organic traffic?
Digging deeper into acquisition analytics under All Traffic, you have the ability to see what pages are driving traffic to your website. Is it Yelp, Google, or TripAdvisor? Knowing which sites are performing the best and which ones are underperforming will give you better insight into which partner channels you need to work to enhance. This can also help you to understand if your advertising with certain sites is working. If you’re advertising with Yelp but seeing low website traffic, what can you do to adjust that content and strategy to generate more traffic?
The last two features under the acquisition reporting are the monitoring of Google Ads and Google Search Console. Having all your Google Ads in one location along with this additional information will help you to determine what is performing well and what is not. The Search Console — if it’s set up correctly — will help you see what keywords are being used to drive organic search traffic to your site. This will help you when determining which keywords you’d like to target in your Google Ads. Understanding this information can be extremely helpful and also overwhelming, as there is a plethora of information at your fingertips. But taking it one step at a time — and recording and analyzing this data regularly — will help your team target your marketing strategy more effectively and more strategically. When you’re ready to dig deeper into the acquisition section of your website analytics, this article does a great job of explaining each acquisition section in detail.
Behavior
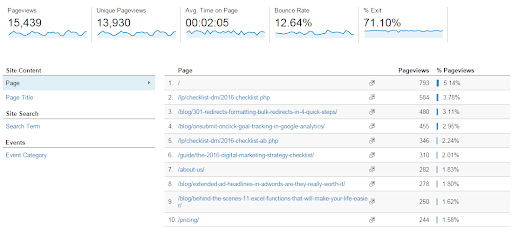 The behavior section is the final chapter to ensuring a quality user experience when it comes to your website. You’ve taken the steps to know who your target audience is, where they’re coming from, and how to market to them. Once they get to your website, your main objective is to convert them to lead or booking. The behavior section of Google Analytics helps to see what your visitors do on your website. Specifically, the reports tell you what pages people visit and what actions they take while visiting.
Once you know which pages are being utilized the most, you can ensure that you add your Tripleseat lead form to them to ensure that you’re converting visitors to leads while they’re on your site. Tripleseat has an easy-to-use lead form that makes responding to event leads easy with templated email responses, and easy to organize through an integrated CRM.
Here, you can monitor your page views, average time on page, bounce rate (to determine the usefulness of the content on your page), and how many visitors exit. This information can get more granular when you look into the behavior flow chart.
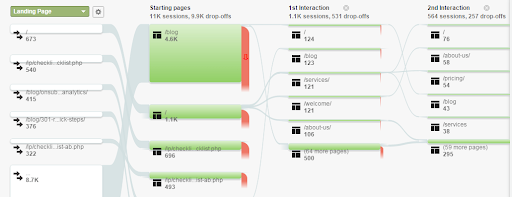 The flow diagram on the right displays the journey of the average website visitor. Knowing how they enter your site, and then the second and third pages they visit, and then how they exit will help you to understand how your visitors absorb your information and their research and decision-making process. After you understand this, you can see where you should add or remove your CTA (call to action), and also rethink your linking strategy. It’s a good idea to follow these paths on your website yourself to experience the user experience, and then you can strategize how to adjust things to help with conversions. If you want to dive a little deeper, this article from Marketing Mojo does a good job of explaining each section of the behavior reporting on Google Analytics.
Overall, the main objective here is that the more qualified visitors to your website, the more conversions and sales you will ultimately see at your venue. So it’s important to understand who your website visitors are, where they’re coming from, and that you’re feeding them the right information. Once you have a good understanding of all of these metrics, you’re in a great position to target your marketing and advertising efforts.
More resources
After you’ve installed Google Analytics and started to measure your key performance indicators, take the next step to drive more traffic to your website by optimizing its Search Engine Optimization or SEO. The goal of your restaurant’s website should be to get as many searches to visit your website as possible. Use these tips to help accomplish that goal: 6 Tips to Optimize Your Restaurant’s SEO.